Maltese Political Parties' Share of Parliamentary Seats
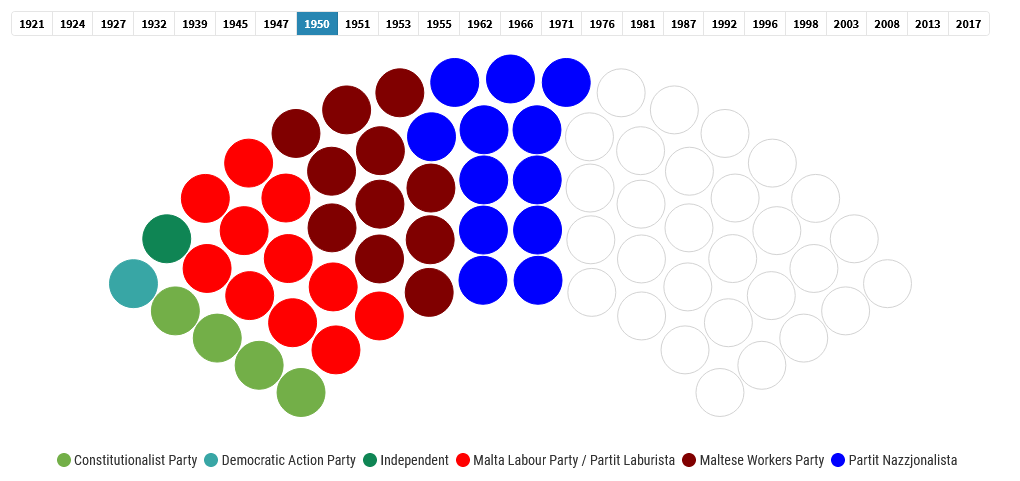
In a recent post, I visualised the number of first count votes received by Maltese political parties since the 1921 national election. This time, I created the above visualisation to show the composition of the Maltese Parliament immediately after every election for the same 1921-2017 period. One can note how historical events such as World War II and several different Constitutional changes made a difference in which parties took part in the elections. The number of total Parliamentary seats also changed over the years, ranging from just 10 seats after the 1939 and 1945 elections, to 69 seats after the national elections of 1987, 1996, and 2008.
References:
Data for the visual above was taken from the University of Malta’s Election project, which you can access here.
You may find more data visualisations I created by clicking here.
